Results 3D window
The Results 3D window displays graphical 3D evaluations according to control parameters set in the control panel of this window. Changes to control parameters are immediately applied and result in new graphical image displayed. The 3D view can be arbitrarily manoeuvred with the mouse in a 3D virtual space (rotations, scaling or translations).
 The image of the resulting 3D view can be rendered to the operating
system's clipboard and then used in further applications (e.g. Word) to
integrate it in personalised reports for example. It can be saved to an
image file or exported as a 3D scene file too.
The image of the resulting 3D view can be rendered to the operating
system's clipboard and then used in further applications (e.g. Word) to
integrate it in personalised reports for example. It can be saved to an
image file or exported as a 3D scene file too.
The window is divided into two areas:
- the 3D view
- the control panel
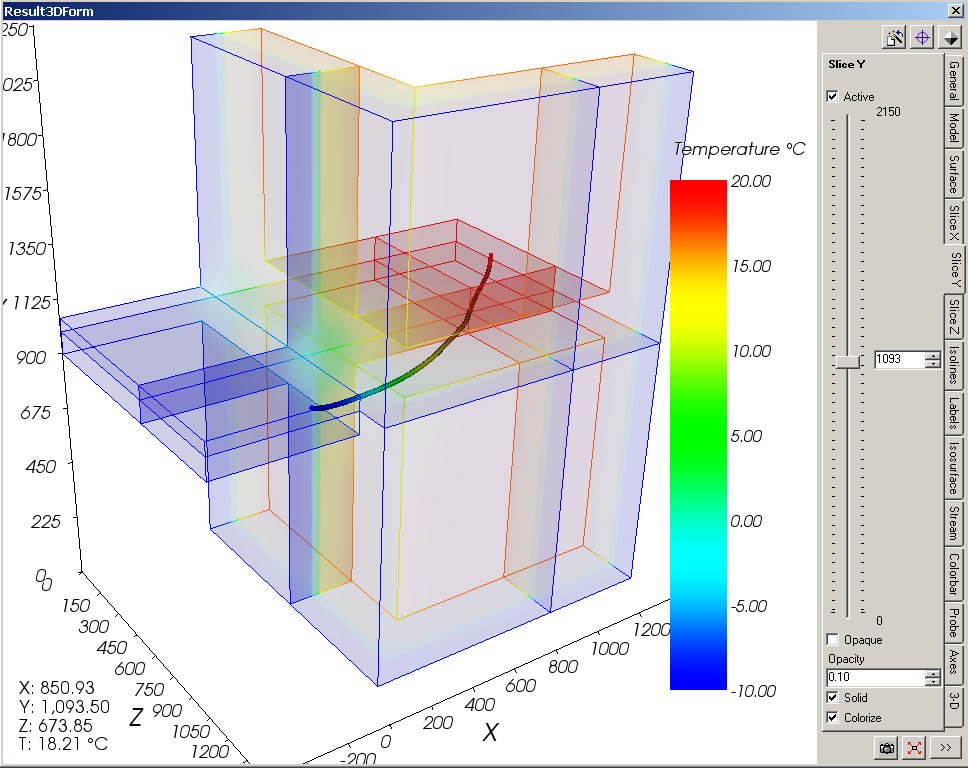
The 3D view shows the visualization of the 3D evaluation. Typically the actual view
is overlaid
with the current colour bar and
with results of probing evaluation (shown at bottom
left). The orientation marker (shown at bottom right) provides feedback of current orientation of axes within the 3D
space. Additional output of program version (bottom right) and license information (top left) will display in the colour being
contrast to current
background colour.
 Actually the 3D evaluation displays a composition of possible
graphical evaluations
which are controlled selectively from the control panel. The arbitrary
composition of these parameters can be collected for later reuse.
Actually the 3D evaluation displays a composition of possible
graphical evaluations
which are controlled selectively from the control panel. The arbitrary
composition of these parameters can be collected for later reuse.
Remark: The position of the control panel can be set in application settings to left instead of right side of the window.
Remark: Within application settings you can decide if the recently used combination of evaluation settings will be restored on initial display of this window.
| TRANSIENT-option: Solving and evaluating time dependant dynamic, periodic problems when heat capacity effects are concerned is only possible with an active TRANSIENT-Option of the program. |
 |
Evaluation of time dependant results of transient problem is controlled either by the evaluation time point T input in the Boundary Conditions window or automated with the Animate Time Dialog.
The Control Panel
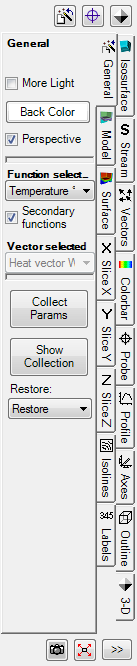 The
control panel is used for selective parameterisation of any of 3D
evaluations and for combining them in to visualizations within the 3D area. The
graphical display resembles changes to various parameters immediately.
The
control panel is used for selective parameterisation of any of 3D
evaluations and for combining them in to visualizations within the 3D area. The
graphical display resembles changes to various parameters immediately.
The final visualization depends on settings of all active evaluations, the opacity of their visual parts and choice of solid or wireframe views.
Which values if temperature, heat flux, humidity and others are evaluated depends on the choice of the active function in the General panel.
Names of respective control panels correspond to the evaluation controlled therein:
| General |
General control parameters like
selection of the active function
evaluated, of
light, of
background colour. |
| Model |
Control parameters of the visualization of construction's model (similar to Elements 3D window) |
| Surface |
Controls parameters of evaluations specific to component's surface. |
| Slice X Slice Y Slice Z |
Control parameters 3D slices (parallel to axes planes) through the building construction |
| Isolines (Isotherms) |
Control parameters of isolines (isotherms, lines of equal heat stream density or surface humidity) |
| Streamlines |
Control parameters for evaluation of (heat-)streamlines within the construction over the vector field of (heat) stream density |
| Vectors HedgeHog Arrows |
Control parameters for evaluation of (heat-)stream vector arrows within the construction over the vector field of (heat) stream density |
| Isosurface |
Control parameters of a isosurface connecting points of equal values |
| Colorbar |
Selection of parameters controlling the colourizing of evaluations by the colour table chosen. |
| Axes |
Control parameters of the display of coordinate axes |
| Probe Probe Cross |
Control of the view of results of point probing. Particular probe can be selected from the list of probe points |
| Profile |
Control a X/Y diagram display of values along a profile line |
| Labels |
Control properties and density of labels and annotations of isolines and the colour bar |
| Outline |
Control parameters of the display showing the
volume's outline. |
| 3-D |
3-D navigation within the three dimensional virtual view space (e.g. rotations, plan views etc.) |
Buttons always accessible: |
|
|
|
Complete combinations of evaluation parameters set and
selected can be collected in the
list of Results3D
parameters and makes them available for later, single step, restoration. Remark: Clicking on this button while holding the Shift- or Ctrl-Key will simply expose the list of Results3D parameters without collecting current evaluation settings (adding the new entry). |
|
|
Current coordinates of the probe point (actual positon of X, Y,
Z slices) are collected to the
list of probe points. Remark: Clicking on this button while holding the Shift- or Ctrl-Key will simply expose the list of probe points without collecting the current point (adding a new entry). See also: Probe (control panel) |
|
|
Current isometry (the 3-D transformation) is collected to
the
liste of isometries.
The list of isometries can be edited in the
isometries window
or a chosen isometry can be selected and applied to the view. Remark: Clicking on this button while holding the Shift- or Ctrl-Key will simply expose the list of isometries without collecting the current camera position (adding a new entry). See also: 3-D navigation (control panel) |
|
|
The position and scaling of the view will be adjusted to ensure that the whole component is visible in the window. |
|
|
The 3D view will be
rendered to the
clipboard of the operating system.
The image can be pasted from the clipboard to another application (e.g. Word) for further processing (e.g. integration in a personalized report. The image can be exported (saved) into an image file . Remark: The size of the image rendered is different from the view on screen and is defined within application settings. |
 Record Video Record Video |
What happens inside the Results 3D window is recorded and saved as a video file in the AVI format. To stop recording click this button another time. |
| [>>>], [<<<] | Hides- and exposes the control panel itself |
The width of the control panel can be adjusted by dragging its border. Place
the mouse pointer over the splitter edge of the control panel (left edge) until
the mouse pointer changes to
![]() . Then hold the mouse button and drag
the edge of the control panel adjusting its width upon to your needs.
. Then hold the mouse button and drag
the edge of the control panel adjusting its width upon to your needs.
Remark: The chosen width will be
saved when the window is closed and
restored on the next display provided the the value is within the allowed range
(116 to 600 display points).
 Placing of the tabs of the control panel and their labels can be set to
right or left. Adjust the setting "Left-align
vertical tabcontrol tabs" within
application settings accordingly.
Placing of the tabs of the control panel and their labels can be set to
right or left. Adjust the setting "Left-align
vertical tabcontrol tabs" within
application settings accordingly.
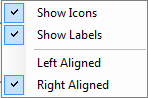
 The tabs can be shown labelled with text titles
and/or displayed with icon symbols (controlled
with context menu of vertical tabs). The
setting "with Icons" only ("text labels" disabled) provides a very compact display of the tabs with only graphical symbols.
All tabs show their respective tooltip also (which might contain further information). By that, even without text labels, the
navigation in the control panels of Results3D is comfortably possible (and does not require any searching in several columns
possible)
The tabs can be shown labelled with text titles
and/or displayed with icon symbols (controlled
with context menu of vertical tabs). The
setting "with Icons" only ("text labels" disabled) provides a very compact display of the tabs with only graphical symbols.
All tabs show their respective tooltip also (which might contain further information). By that, even without text labels, the
navigation in the control panels of Results3D is comfortably possible (and does not require any searching in several columns
possible)
The control panel can be hidden or exposed by clicking onto the button [>>>] or [<<<] respectively.
Following control settings are common:
Remark: Actual creation of 3D evaluations result in relatively high memory
demands. Systems equipped
with less then 512MB RAM will experience significant delays in execution due to
extensive paging. The number of
secondary
functions chosen for evaluation significantly controls these demands.
Important: In the case memory demands cannot be satisfied by the system
error message will be displayed. If the application is still responsive after
such an error message please save your data immediately and restart the
application.
Remark: Current position of the 3D view (the isometry given by the current view vector) will be retained when the window is closed and saved when the application exits. The next time the window is opened the view isometry will be restored if such behaviour is set within application settings.
Remark: During the time the system is busy with rendering the new evaluation view (possibly very complex calculations) the mouse pointer will change to clock symbol (when placed over the control panel).
Remark: When this window is focused following additional, window specific, functions are available from the main menu:
- View→3D navigation functions (plan views, rotations, perspective etc.)
- Edit→Copy Image 3D to render the image onto the clipboard
- File→Export→Image 3D... to save the rendered image to a image file
- File→Export→Scene 3D... to save the rendered 3D scene into a 3D scene file.
Remark: The size and proportions of the image rendered to the clipboard can be set within application settings.
Saving and Restoring parameter combinations
![]() Complete combinations of evaluation parameters set and selected can be collected
in the
list of Results3D
parameters and makes them available for later, single step,
restoration with a double click.
This provides the valuable ability to quickly restore parameter combinations
earlier saved, thus allowing reproducible visualizations.
Complete combinations of evaluation parameters set and selected can be collected
in the
list of Results3D
parameters and makes them available for later, single step,
restoration with a double click.
This provides the valuable ability to quickly restore parameter combinations
earlier saved, thus allowing reproducible visualizations.
Nearly all parameters set
within control panels are retained there as list entries. Parameters specific to
evaluation function are handled otherwise.
Function specific evaluation parameters
Evaluation settings which are specific to the evaluated function (i.e. to different active function, for example the temperature, heat flux, pressure, ...) will be collected internally for each chosen evaluation function. When the selection of the active function is changed the settings specific the the one chosen will be restored respectively - for optimal and comparable visualization of results for different projects.
By that it can be ensured that settings dependant on values of specific function (e.g. colours of the colour table, applicable assignment of colours to value domain, step of isolines, labels' parameter, etc.) will be kept invariant, as far as possible, for all projects.
| Active Function specific evaluation parameters: | |
| Color Bar | Fixed Range (TotalRangeEditable), Range-Min/Max (TotalMinimum/MaximumValue), Min/Max (RangeMinimum/MaximumValue), Clamp range (Clamp), Colour table (ColorTable) and Label parameter (see below) |
| Isolines | Fixed Range (TotalRangeEditable), Range-Min/Max (TotalMinimum/MaximumValue), Min/Max (RangeMinimum/MaximumValue), Clamp range (ClampRange), #interv. (NoOfIntervals/Enabled), Step (Step/Enabled), Start At (StartAt/Enabled), Bold n-th (HighlightEachNth/Enabled) and Label parameter (see below) |
| Labels | Color Bar: # Intervals (ColorBarLabelsIntervals), Color Bar: Decimal digits (ColorBarLabelsDigits), Isolines: Font size [pts] (IsolinesLabelsFontSize), Isolines: Decimal digits (IsolinesLabelsDigits) |
| Isosurface | Value (IsosuraceValue) |
This function specific parameters, when set in the control panels, will be collected continuously for each evaluation function selected and saved within application settings when Result3D window closes.
Important: The function specific parameters do not run into the collection of "Results3D Parameter" (neither Project nor Standard). The function specific evaluation parameter are application setting.
See also: Results and Evaluation, Evaluation & Results windows, Active (setting), Fixed Range (setting), Solid or wireframe (setting), More Light (setting), Background Colour (setting), Copy image to the clipboard, Please Wait window, Elements 3D window, Results3D Parameter window, Isometries window, Restore last Result3D Parameters (application setting), Animate Time Dialog