Isolinies / Isotherms  (control panel)
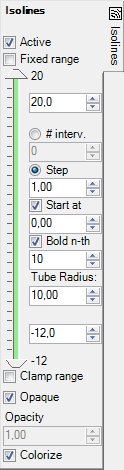
The control panel Isolines is used to adjust parameters of isoline evaluations (isotherms, in the case of temperature is chosen for the active evaluation function).
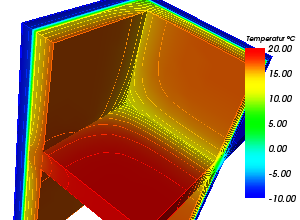
Isolines are shown colorized. Actual colorizing follows values of currently active function (temperature, heat flux, surface humidity etc. - selected within General control panel) and currently selected Colour table.
The isolines (or isotherms) are drawn on component's surface or on slice planes, and are therefore only visible if these evaluations are active also. Settings chosen within control panels Slice X, Slice Y, Slice Z and Surface have thereafter an impact onto evaluation of isolines.
Which isolines are shown can be selectively chosen by setting the number of
intervals (#Interv.) or by choosing the step value. Isolines will be created
only for values within the interval Min and Max according to the input therein.
At initial view of isotherms the interval of 1°C, starting at 0°C is set and
isolines shown.
Isolines can be labelled accordingly also and/or emphasized bolded (as a tube).
| Active, Opaque, Colorize | Decide about the visibility, colorizing and transparency of the lines shown |
| Fixed range | If turned on the value range for isolines' creation can be set arbitrarily, independent of the current value range of the evaluated function. |
| Range-Min/Max | The values of Maximum and Minimum, shown at the top and
bottom of the panel, display the current extent of selected evaluation
function. When "Fixed range" is chosen both values can be set arbitrarily, independent of the current value range of the evaluated function. |
| Min/Max | The interval can be reduced by the input in the respective fields. The input can be performed either by the entry of numeric values into the respective input field or by moving the sliders between the extent values. |
| #interv. | Number of equidistant intervals dividing the extent between
the input Min and Max values.
The step will be calculated from these values. |
| Step | The value interval at which isolines shall be drawn. |
| Start at | The start value fro which (in both directions, towards Min and towards Max) the values of isolines to be drawn shall be calculated. |
| Bold n-th | Selected isolines (each N-th) will be shown emphasized
(Bold n-th) - as a thick tube instead of a thin line. Isoline labels are shown only on bolded lines if the option "Bold n-th" is chosen. Remark: The tube itself if always partially transparent to allow proper display of isoline labels (visibility test) |
| Tube Radius | Emphasized isolines (switched on by "Bold
n-th") are shown as a tube to better emphasize respective isolines (compared to single pixel thick line). The radius is entered in units
of the coordinate system - i.e. millimetres. Setting the tube radius = 0
will show it as simple line. Remark: The number of sides rendered for the tube can be adjusted within application settings. |
| Clamp range | Limits the isolines created to the values within the Min/Max interval specified. If switched off (default) the isolines are created for the whole value range available in the data set. |
Remark: It is advisable to adjust the surface "holding" the isolines (i.e.
Surface or
Slices) by showing it
transparent or opaque.
Alternatively adjust colorizing of isolines
or the surface "holding" them to dark or bright to receive the
required contrast of the image.
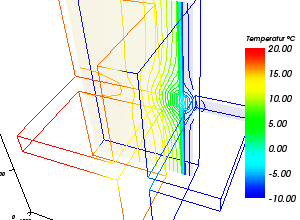
Remark: Because slice planes, holding isolines, intersect with model's
interior only it is advisable to either turn the view of the surface
completely off or show it partially transparent (i.e.
not opaque) or show it as
wireframe only.
The tooltip of the tab will show up if the surface
obscures objects rendered within the interior of the model.
Remark: Isolines are lines shown and colorized by the constant value of the primary function chosen (Isotherms, lines of equal heat flux, lines of equal surface humidity, and so on). Isolines are displayed on construction's surface (Surface) and on slice planes (SliceX,Y,Z) (only if these are active). To show isolines only, without the surface "holding" them, turn that surface completely transparent (set opacity = 0). The selection of values at which isolines are shown is givien by the definition of a start value (Start at) and of a interval length (Step) (or number of intervals).
Remark: The visibility of isolines is directly dependant on the
visibility of the surface object holding it:
→ Isolines on the component's surface are only visible if the
Surface is also active. To get better view onto
isolines turn the surface transparent – Surface→Opacity=0.0;
→ Isolines on slices (X/Y/Z) are only shown if
the respective slice is also active. To get better view onto isolines turn the
respective slice transparent – SliceX/Y/Z→Opacity=0.0
Hint: Fix the Range to receive comparable results by decoupling it from the actually evaluated domain. This function specific setting takes care for keeping the range constant regardless of changes to boundary conditions, evaluation time point, animation or for different projects.
See also: Results 3D window, Active (setting), Opaque and Opacity (setting), Colorize (setting), Solid or Wireframe (setting), General (control panel), Active Function, Isosurface (control panel), Labels (control panel), Fixed Range (setting)