Labels  (control panel)
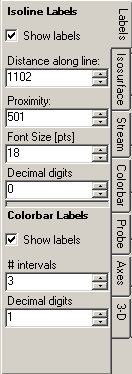 The
control panel Labels contains settings for labelling of
Isolines
and of the Colorbar
The
control panel Labels contains settings for labelling of
Isolines
and of the Colorbar
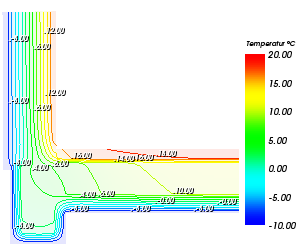
Labels on Isolines
Labels of Isolines are placed over Isolines shown over the slice planes X/Y/Z or over component's surface.
| Show labels | Turns labelling of isolines on or off |
| Distance along line | The distance between labelling points along each isoline (staring
at the middle of each polyline of each isoline) The initial value of the distance value is calculated based on the median extent of the component modelled (1/3 of it). |
| Proximity | The minimum distance between any two labelling points. |
| Font size [pts] | Size of letters used for labels. The actual size scales with the height of the 3d view. |
| Decimal digits | Number of decimal digits after decimal comma to show on isoline labels. |
Remark: In general it is advisable to keep the distance along line at 1/3 of the component's extent. The proximity is commonly changed together with the font size. Generally the Proximity is always smaller then Distance along line.
Remark: Visibility of each separate label is checked against all opaque surfaces and objects within the view. Transparent surfaces and do not obscure labels.
Remark: Labels of isolines shown with active isoline option "Bold n-th" are shown on emphasized isolines only.
The tricky algorithm positioning the labels can be described as follows:
- Each isoline is represented by a polyline - under certain circumstances there will be many polylines for the same isoline value generated (sections of isolines).
- The initial labelling point is set at the middle of such polyline (very short polylines are skipped).
- Starting from that initial point, in both directions of the polyline, further points will be placed - repeatedly at each distance along line.
- After all points are set for all polylines the distance of each pair of points is tested against proximity - one of the points is removed if the distance is less then the set proximity value. This avoids overlapping of labels placed too nearly (below the value of proximity) to each other.
- All labelling points are tested for their visibility - this highly depends on the orientation of the 3d view. Points obscured by opaque surfaces are removed.
- All points still on the list are used to place labels in requested font size. The size and orientation of labels is independent of the current 3d transformation.
Labelling the Colorbar
Value labels of the colorbar are placed at one side of the coloured bar.
| Show labels | Turns labelling of
colorbar on or off |
| # Intervals | Defines the number of intervals at which the colorbar shall be labelled. |
| Decimal digits | Number of decimal digits after decimal comma to show on colorbar labels.. |
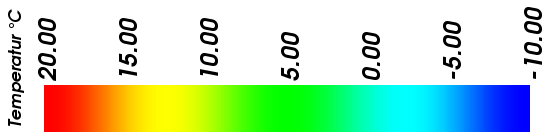
Remark: When Results3D is showing a periodic evaluation at some time point, the title of the colour bar will
display that value.
See also: Isolines / Isotherms (control panel), Slice X,Y,Z (control panel), Results 3D window, Colorbar (control panel)